The Real Cost of Multi-Cloud in 2026: AWS re:Invent 2025 Promises vs. Actual Egress Bills

The Theater of Competitive Pricing

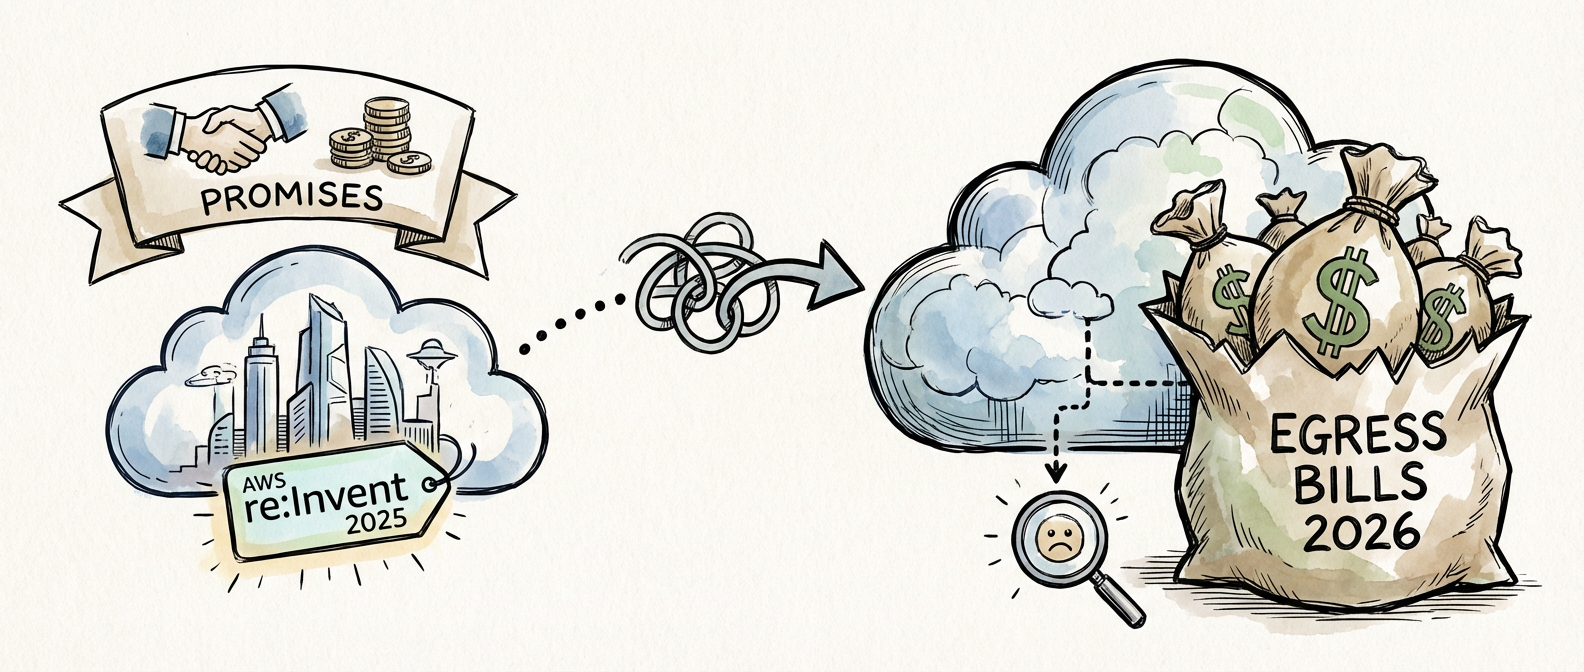
Every November, the cloud vendor circus rolls into Las Vegas, and this year was no different. AWS re:Invent 2025 delivered the expected announcements: further S3 price reductions, expanded zero-egress partnerships with select CDN providers, the whole performance designed to signal that Amazon heard the complaints about vendor lock-in and runaway data transfer costs. Google showed up with their Cross-Cloud Network, positioning it as the answer to multi-cloud complexity. Azure quietly did Azure things. And somewhere in a conference room, a procurement team got excited about a slide deck.
The Real Cost of Multi-Cloud in 2026: AWS re:Invent 2025 Promises vs. Actual Egress Bills

Here’s what I want you to understand before you start updating your spreadsheets: vendor announcements about pricing are theater. Effective theater, sure, but theater nonetheless. The reductions are real. The partnerships are real. But they solve a very specific problem for a very specific subset of customers, and they do not solve the problem most of us actually face.

Illustration for The Real Cost of Multi-Cloud in 2026: AWS re:Invent 2025 Promises vs. Actual Egress Bills

What the Bandwidth Alliance Actually Covers (And What It Doesn’t)

Let me be direct about Cloudflare’s 2025 Bandwidth Alliance data because I’ve spent enough hours staring at egress charges to have opinions. Enterprises moving data between major cloud providers outside of these formal agreements are still looking at $0.08 to $0.09 per gigabyte for high-volume transfers. That doesn’t sound like much until you do the math on your actual workloads. A modest 100 TB month-long replication operation? That’s between $8,000 and $9,000. Suddenly the Terraform code you wrote to be “cloud-agnostic” starts looking real expensive.

The zero-egress agreements that AWS and Google announced do exist and do work, but here’s the catch: they require you to be using specific CDN partners with specific architectural patterns in specific regions. It’s not zero-egress in general. It’s zero-egress if you conform to what they’ve decided is acceptable. For some teams, that’s a perfect fit. For the rest of us running hybrid workloads across regions and providers, it’s like being told the free parking is available if you’re willing to park exactly where they say.

The Governance Gap That Keeps Engineers Awake

Here’s where things get uncomfortable, and I’m going to say this as someone who genuinely respects both cloud architects and finance teams even when they drive each other to drink: the tools don’t exist yet to actually manage multi-cloud costs with any real sophistication. According to the Flexera 2026 State of the Cloud Report, 89% of enterprises claim to have a multi-cloud strategy. That same report also found that only 28% have mature cost governance tools in place across all their providers. That’s not a typo. That’s an eight-to-one gap between ambition and capability.

Gartner’s 2025 Cloud Cost Optimization report landed a number that should make any CTO’s eyes water: 35% of enterprise cloud spend is being wasted. The egress fees aren’t even the biggest culprit anymore. Multi-cloud networking costs are growing as a share of that waste, but they’re competing with overprovisioned instances, orphaned storage, unused reserved capacity, and the thousand small mistakes that compound across multiple providers with multiple billing systems and multiple rate cards.

The cost governance tools you’re looking at right now probably work beautifully for single-cloud environments, or for giving you dashboards that make you feel informed while you’re actually just getting very good at reading fiction. Real multi-cloud cost tracking requires visibility into inter-cloud networking, requires understanding the actual data flows in your architecture, requires knowing what you’re optimizing for. Most organizations don’t have that visibility. They have billing alerts.

Google’s Cross-Cloud Network and the Maturity Illusion

Google Cloud’s Cross-Cloud Network announced at Google Cloud Next 2025 deserves a separate moment because it represents both genuine progress and the exact kind of vendor limitation that keeps multi-cloud from actually working. The product is architecturally sound. The promise of simplified inter-cloud connectivity is real. But it comes with a critical constraint: workloads have to run on supported regions. In practice, this means you’re trading one form of lock-in for another. You’re no longer locked into a single cloud provider, but you are now locked into specific geographic deployment patterns that Google has decided to support.

This is what happens when vendors get serious about multi-cloud adoption: they solve the problem in a way that benefits their own position. Google gets to host your control plane. Google gets to see your traffic patterns. Google builds the network backbone you depend on. It’s not sinister, but it’s also not the vendor-agnostic nirvana that the marketing copy suggests.

What This Means for Your 2026 Planning

If you’re sitting in a planning meeting right now trying to decide whether to standardize on one cloud or to embrace the multi-cloud future, here’s what I’d tell you: the technology for multi-cloud is getting better, but the economics are getting worse for most organizations. The vendors have gotten smarter about competing without actually competing on the things that matter most to you.

Your data transfer costs aren’t going away. Your governance gaps aren’t going away. The complexity of managing workloads across three different billing systems, three different networking models, and three different optimization strategies isn’t being solved by better pricing for certain edge cases. You want to know what actually helps? Rigorous architecture review. Understanding your data flows before you commit to a topology. Building cost observability into your deployment pipeline the same way you’ve already built security. Choosing your multi-cloud approach based on workload requirements, not based on conference announcements.

The AWS pricing reductions are real wins for the companies that can use them. Google’s network improvements are genuine technical progress. But they’re not solving the fundamental problem: most enterprises haven’t developed the organizational capability to actually manage multi-cloud well. They’ve developed the organizational will to try it. There’s a meaningful difference.

I’m curious what you’re seeing in your own environments. Are the vendor pricing moves actually shifting your decision-making, or are you finding that the hidden costs of multi-cloud coordination are bigger than the sticker price differences? Have you found cost governance tools that actually work across multiple providers, or are you rolling your own? The real intelligence here isn’t in the vendor announcements. It’s in what you’ve learned about your own infrastructure through trial and error. Drop those insights in the comments if you’re willing to share.


The Real Cost of Multi-Cloud in 2026: AWS re:Invent 2025 Promises vs. Actual Egress Bills

The Pricing Theater We All Fell For

I sat in the keynote hall at AWS re:Invent 2025 watching Andy Jassy announce another round of S3 price cuts, and I felt that familiar feeling: the one you get when you know the headline is technically true but fundamentally incomplete. Yes, Amazon reduced storage pricing again. Yes, they signed new zero-egress agreements with select CDN partners. The competitive pressure from Google Cloud and Azure is real, and these moves prove it. But I’ve been here before. I’ve watched the pricing charts get better while my quarterly bills kept climbing, and I know exactly why.

The trap isn’t in the math on the slide deck. It’s in what happens at 2 AM when your workload in us-east-1 needs to shuffle data to your Kubernetes cluster in eu-west-1, or worse, to a workload running on Google Cloud because the business unit made a separate commitment last fiscal year. That’s when storage pricing becomes almost decorative. That’s when egress fees become the actual story.

The Egress Tax Nobody’s Talking About

Cloudflare’s 2025 Bandwidth Alliance research tells a sobering story. Enterprises moving between major cloud providers still face average egress charges of $0.08 to $0.09 per gigabyte for high-volume transfers that fall outside alliance agreements. Let me put that in real terms. If your team is running a daily backup process that moves 500 GB between AWS and Google Cloud, that’s $40 to $45 per day just in transfer costs. Multiply that across a year, across multiple data centers, across multiple business units that don’t talk to each other, and you’ve discovered where $0.08 per gigabyte turns into genuinely painful money.

I looked at our own transfer logs last quarter and did the calculation that made me stare at my screen for too long. We were paying more in egress fees than we were paying for the storage itself. Let that sink in. The commodity, the actual bytes, was cheaper than the privilege of moving them across the internet. And we had what we thought was a decent optimization strategy. We just didn’t have visibility into the full picture until we actually looked.

The asymmetry is what kills you. Moving data into AWS? Basically free. Moving it out? That’s where Amazon captures the margin. Google and Microsoft follow the same playbook. It’s not malicious. It’s just business, architected in a way that makes leaving expensive.

The Governance Gap That Costs Everything

According to the Flexera 2026 State of the Cloud Report, 89 percent of enterprises now have a multi-cloud strategy. That’s not surprising. What is surprising, in a way that keeps me up at night, is that only 28 percent report having mature cost governance tools that work across all their providers. Eight out of ten companies are playing multi-cloud chess while simultaneously flying blind. They’re making architectural decisions, spinning up resources, and committing to data transfers without a unified framework for understanding the cost implications.

Gartner’s 2025 Cloud Cost Optimization report put a number on the damage: 35 percent of enterprise cloud spend is wasted. And here’s the part that stings: multi-cloud networking costs are growing as a share of that waste. We’re not just throwing money away on idle instances anymore. We’re throwing it away on the architecture itself, on the complexity tax that multi-cloud introduces.

The problem compounds because each cloud provider gives you tools to optimize costs within their walled garden. AWS has Compute Optimizer. Google Cloud has Active Assist. Azure has Advisor. None of them can see across the fence. None of them can tell you that your multi-cloud strategy is fundamentally misaligned with your workload patterns. You have to do that work yourself, and it’s brutal work.

The New Connectivity Solutions That Mostly Don’t Help

At Google Cloud Next 2025, Google announced Cross-Cloud Network as the solution to inter-cloud complexity. Simplified connectivity. Lower latency. Unified management. It sounds elegant, and the engineering is genuinely impressive. There’s just one catch: it only works for workloads running on supported regions, and not all of your workloads are going to fit into that constraint. The promise is real. The practical adoption is limited. I’ve seen this pattern enough times to recognize it now.

This is where the rubber meets the road. The cloud providers are offering solutions to the multi-cloud problem they created in the first place. The irony would be funny if it wasn’t so expensive. You can reduce your egress costs by consolidating onto a single provider’s recommended architecture. You can avoid the complexity tax by not having a multi-cloud strategy. But the business made the strategic decision to work with multiple clouds, so here you are, paying for the privilege of that flexibility.

What Actually Works

After years of watching these cycles, I’ve learned that the solution isn’t technical elegance. It’s brutal honesty about your architecture. You need to understand your data gravity. You need to know which workloads are truly tied to specific cloud providers and which ones are just living there out of inertia. You need cost visibility that works across clouds, not just within them.

When you look at the AWS data transfer pricing breakdown, you start to see the levers. Region-to-region transfers have different costs than inter-cloud transfers. Inbound is cheaper than outbound. There are small incentives buried in the pricing structure that point toward the architecture they’d prefer you to build. Understanding those incentives is half the battle.

The other half is accepting that multi-cloud optimization requires you to be smarter than the sum of the tools the providers give you. Consolidate what matters, be ruthless about what doesn’t, and accept that real flexibility across clouds costs money. Real money. The kind that shows up on the invoice.

I’m curious what your organization has learned from this. If you’ve managed to build effective cost governance across multiple clouds, or if you’ve hit the same wall I have, I’d like to hear about it.

The Platformization Trap: Why CrowdStrike’s 2025 Threat Report Should Make Every Mid-Size Engineering Team Rethink Their Security Stack

The 62-Minute Problem Nobody Wants to Admit They Have

Let’s start with the uncomfortable number that should be keeping your security team awake at night. The CrowdStrike 2025 Global Threat Report documents something genuinely alarming: adversaries are going from initial access to lateral movement in an average of 62 minutes. That’s down from 84 minutes just one year prior. We’re talking about a 26% compression in the window where defenders actually have time to detect, respond, and contain a breach. In practical terms, that means your incident response playbook probably isn’t fast enough anymore. Full stop.

The Platformization Trap: Why CrowdStrike's 2025 Threat Report Should Make Every Mid-Size Engineering Team Rethink Their Security Stack
The Platformization Trap: Why CrowdStrike’s 2025 Threat Report Should Make Every Mid-Size Engineering Team Rethink Their Security Stack

What makes this worse isn’t just the speed. It’s the directness. These aren’t fumbling attackers doing reconnaissance. Modern adversaries are moving with purpose, which tells us they’ve either compromised your environment before, they’ve done their homework on your specific infrastructure, or both. The breakout time metric is telling you something important: detection latency is now your biggest liability. If your security tools can’t see anomalous behavior within 30-40 minutes, you’re essentially operating blind. The intruder will already be three network hops ahead, establishing persistence, exfiltrating data, or pivoting to high-value targets while your SOC is still pulling their morning coffee.

The China-Nexus Cloud Explosion Nobody’s Really Talking About

Here’s where the threat landscape gets genuinely interesting. The CrowdStrike report flagged a 150% year-over-year increase in adversary activity from China-nexus groups, with a specific and deliberate focus on cloud environments. But the really actionable detail is the targeting pattern: these actors are hunting compromised CI/CD pipeline credentials like vultures circling a carcass. If you’re a mid-size engineering team running builds through GitHub Actions, GitLab CI, or Jenkins without hardened credential management, this one’s personal.

Why CI/CD pipelines? Because they’re the skeleton key to your entire infrastructure. A compromised pipeline credential doesn’t just give you access to one system. It gives you a trusted position inside your build and deployment chain. From there, you can inject malicious code into artifacts, poison container images, or stage infrastructure changes that look completely legitimate because they came through the normal deployment process. The signal here is unmistakable: if you’re not treating your pipeline credentials with the same rigor as production database passwords, you have a fundamental security gap. And the bad actors know it.

The Platformization Trap and Why Consolidation Feels Good But Hurts Later

Now let’s talk about the architectural decision that’s currently reshaping enterprise security spending, and why it should concern you even if your organization is only moderately sized. Gartner’s latest Magic Quadrant data shows that 58% of enterprise security buyers are now pursuing platform consolidation strategies, bundling endpoint detection and response, cloud security posture management, and identity threat detection under a single vendor. That’s nearly double the 31% adoption rate from just three years ago. The appeal is obvious: fewer vendors means fewer contracts, less integration glue code, simpler compliance audits, and a single pane of glass for your security team. It feels elegant.

Here’s the problem with elegance in security architecture: elegance and resilience usually sit at opposite ends of the same axis. When everything flows through one vendor, everything depends on one vendor. You get efficiency at the cost of brittleness. The July 2024 CrowdStrike Falcon sensor update incident proved this thesis at scale. An automated update to a kernel-level security component broke 8.5 million Windows devices globally. Not because the vendor was malicious, not because the code was intentionally harmful, but because when you give a single vendor that much responsibility at that level of the stack, mistakes become catastrophic events measured in hours of downtime across entire industries.

The wake-up call here is subtle but real. Consolidation creates operational simplicity in good times and amplifies fragility in bad times. Your incident response capability is only as strong as your ability to isolate and contain compromised components. If your endpoint detection, cloud visibility, and identity protection are all managed by the same vendor through the same platform, you don’t have containment options when that platform fails. You have a binary choice: accept the outage or make emergency decisions under pressure without proper testing.

Vulnerability Disclosure at 48-Hour Exploitation Speeds

The vulnerability landscape has shifted in a way most organizations haven’t actually operationalized. The CISA Known Exploited Vulnerabilities Catalog now contains over 1,200 entries, and here’s the statistic that should change how you think about patch management: 40% of those vulnerabilities are being actively exploited within 48 hours of public disclosure. Forty percent. That’s not a tail event. That’s the new normal.

What this means operationally is that your patch SLA framework, if it’s still measured in weeks or even days, is now a measurable security liability. You can’t patch everything instantly. Your production systems need stability. But you need to make ruthless decisions about what gets prioritized, and those decisions need to happen in hours, not days. This requires a different kind of visibility entirely. You need to know, within minutes of a CVE disclosure, whether that vulnerability affects your specific tech stack, whether you have exploitable exposure, and what your blast radius would be if an adversary weaponizes it. Most organizations don’t have that level of operational clarity about their own infrastructure. That’s not a judgment. It’s an observation about the gap between current practice and current threat velocity.

What This Means for Your Next Architecture Decision

The pattern connecting these data points is clear: the threat landscape is compressing timelines everywhere. Initial access to lateral movement in 62 minutes. Vulnerabilities exploited in 48 hours. Platform dependencies creating single points of catastrophic failure. The old model of layered, slowly-updated security perimeters is officially inadequate.

For mid-size engineering teams, this creates a specific mandate. Think about your security architecture not as a collection of tools but as a system designed for rapid observability and containment. That might mean accepting some vendor fragmentation as a resilience feature rather than a procurement headache. It probably means investing in better internal logging and correlation capabilities so you’re not completely dependent on any single platform’s analysis layer. It definitely means running regular game days to practice what happens when a major security component fails, not as a compliance checkbox but as a core operational skill.

The most important decision you can make is to reject the narrative that more consolidation equals better security. The data suggests the opposite. Better security comes from understanding your dependencies clearly enough to operate without them if necessary. That’s harder to sell to budget committees. It also works better when the pressure is on. I’m genuinely curious how teams are threading this needle in their own environments. If you’ve dealt with platform consolidation decisions or redesigned around single-vendor risk recently, I’d love to hear how those conversations actually played out.

The 1,200-Vulnerability Milestone We’re All Pretending Isn’t a Crisis

When Patch Management Became a Numbers Game You’re Losing

Late 2025 hit a milestone that should have been a clarion call in security circles instead of a quiet statistic. The CISA Known Exploited Vulnerabilities Catalog surpassed 1,200 entries. That’s not a number you can dismiss as “manageable” or “under control.” It’s the moment where your patch management process—the one you’ve probably been nursing along with duct tape and automated email alerts—stops being a scalability problem and becomes an existential one.

The 1,200-Vulnerability Milestone We're All Pretending Isn't a Crisis
The 1,200-Vulnerability Milestone We’re All Pretending Isn’t a Crisis

Think of it this way: federal agencies now operate under BOD 22-01, which mandates remediation of critical-severity vulnerabilities within 15 days. That sounds reasonable until you realize that the median time-to-exploit for newly published CVEs dropped to just 5 days in 2024, according to the Verizon 2025 Data Breach Investigations Report. Back in 2021, you had 32 days. Now you have five. The math doesn’t work anymore, and everyone knows it.

Illustration for The 1,200-Vulnerability Milestone We're All Pretending Isn't a Crisis
Illustration for The 1,200-Vulnerability Milestone We’re All Pretending Isn’t a Crisis

The Exploit Window Collapsed While You Were in Meetings

Here’s where it gets genuinely unsettling. In January 2026 alone, CISA added 47 new actively exploited vulnerabilities to the catalog. Nearly two per day. Among them were multiple zero-days affecting Palo Alto Networks PAN-OS and Ivanti Connect Secure, systems that many of you depend on, systems that had patches available in vendor bulletins but hadn’t made it into most deployment pipelines because your triage workflow is still based on quarterly patch cycles or some variant of organized chaos.

The uncomfortable truth buried in this timeline is that vulnerability exploits aren’t waiting for your change advisory board to convene. They’re not respecting your maintenance windows or your capacity planning. The threat actors got faster while your processes stayed exactly the same. That’s not a technology problem anymore. That’s an organizational one.

The National Vulnerability Database Overwhelm Is Real

Let’s look at the raw signal-to-noise problem. The National Vulnerability Database processed over 40,000 new CVEs in 2024, a 38 percent jump from 2022. Your automated triage pipelines, the ones running in some corner of your security infrastructure right now, are drowning in volume. Machine learning models trained on historical patterns become less predictive when the input stream increases by that magnitude. You end up with alert fatigue on steroids.

Most teams I’ve worked with or talked to at conferences operate under the assumption that severity scoring and CVSS vectors will handle the triage burden. They won’t. A CVE with a 7.2 score could be completely irrelevant to your environment, or it could be the exact vulnerability an attacker is chaining into your third-party plugin. The scoring system, for all its refinements, is fundamentally static. Your environment is not.

The Patch That Wasn’t Actually Applied

Here’s the finding that should keep you awake: a 2025 Tenable research report noted that 60 percent of breaches in surveyed organizations involved a known vulnerability for which a patch had been available for more than 30 days at the time of exploitation. Not a zero-day. Not an unpatched system from 2015. A patch that existed, that was documented, that an admin somewhere probably even saw in an email or dashboard, but never made it into production.

This is the true vulnerability crisis nobody wants to acknowledge. It’s not that we lack patches. It’s that we lack the operational discipline and tooling to deploy them at velocity. Your asset inventory is probably incomplete. Your patch management system probably doesn’t talk to your network segmentation strategy. Your incident response team might not even know what vulnerability was involved in an intrusion until the forensics team explains it three weeks later.

What Actually Works (And What You’re Probably Not Doing)

Here’s where I get enthusiastic, because there are actually elegant solutions emerging that don’t require tearing down everything you’ve built. The organizations I’ve seen handle this well operate under a few principles that run counter to traditional patch management dogma.

First, they stop treating all vulnerabilities as equal. They implement context-aware prioritization that maps CVEs to actual assets, exposure paths, and business criticality. A vulnerability in a system nobody can reach from the internet gets flagged differently than one affecting a public-facing API. This requires better asset management, sure, but asset management is foundational to everything anyway.

Second, they’ve decoupled patch deployment from formal change control for certain categories of updates. They maintain rapid-deploy channels for actively exploited vulnerabilities flagged by CISA or similar authoritative sources. Your change advisory board meeting happens quarterly. The threat intelligence cycle operates in days. Those timelines don’t reconcile.

Third, the organizations actually succeeding at this have invested in better visibility into their vulnerability lifecycle. They track not just whether a patch exists, but where it’s staged, which systems still need it, what testing it cleared, and why it hasn’t been deployed if it hasn’t. That transparency alone, boring as it sounds, eliminates most of the gaps.

The 1,200-Entry Marker Isn’t the Problem; It’s the Warning Light

The fact that CISA’s catalog hit 1,200 entries shouldn’t alarm you because the number is large. It should alarm you because it represents an acceleration you can’t outpace with your current operational model. The gap between “vulnerability disclosed” and “vulnerability exploited in the wild” has compressed to the point where your quarterly patch cycle is a historical artifact.

If you’re reading this and your organization is still running on traditional patch management workflows, this is the moment to escalate internally. Not as a technical problem for your security team to solve in isolation, but as an organizational priority that touches procurement, operations, architecture, and governance. Your current approach worked when exploits took weeks to show up. It doesn’t work when they show up in days.

If you’ve implemented something that actually moves the needle on your deployment velocity, or if you’ve hit a wall that your current tooling can’t solve, drop a comment. I’m genuinely interested in what’s working and what’s not working at scale because this problem is too big for any one team to figure out alone.

The $47,000 Lambda Bill That Changed How I Think About Cloud Costs

When AWS Sends You a Bill That Makes You Question Everything

Last month, a startup I advise got slammed with a $47,000 AWS bill. The culprit? A single Lambda function that was supposed to process image thumbnails. Somewhere between the eager junior dev who wrote it and the Friday deployment, a recursive loop turned their innocent thumbnail generator into a digital money furnace. By Monday morning, they’d burned through their entire seed funding runway in compute costs.

This wasn’t some exotic edge case or architectural hubris. It was a perfectly reasonable microservice that went sideways because nobody was watching the meters. And frankly, it could happen to any of us who’ve gotten comfortable with the “serverless means cheaper” narrative. Sometimes the cloud gives you exactly what you ask for, even when what you’re asking for will bankrupt you.

The real kicker? The monitoring tools that could have prevented this disaster were sitting right there in their AWS console, unused. Which got me thinking about all the cost optimization strategies we collectively ignore because they’re not sexy enough for conference talks.

Reserved Instances: The Unsexy Hero of Your Budget

Everyone talks about spot instances like they’re the holy grail of cost optimization. Sure, saving 70% sounds great until your training job gets interrupted for the fifth time this week. Meanwhile, Reserved Instances sit in the corner like the reliable friend who always shows up but never gets invited to the party.

Here’s what changed my perspective on RIs: I started treating them like real estate investments instead of server purchases. You’re not buying servers; you’re buying capacity futures. And like any good futures contract, the magic happens when you understand the underlying patterns. If you’ve been running the same t3.medium instances for six months straight, converting to RIs isn’t optimization, it’s basic financial hygiene.

The trick is using AWS Cost Explorer’s RI recommendations, but actually reading the fine print. Those recommendations assume your usage patterns will stay constant, which is adorable if you’ve ever worked at a growing company. Instead, look at your minimum baseline usage across instance families. That t3.medium that’s been humming along for months? Perfect RI candidate. That c5.4xlarge you spin up for monthly reports? Maybe not.

Tagging Strategy That Actually Works in Production

I’ve seen more elaborate tagging strategies than I care to remember, and most of them die within three months. The problem isn’t the tags themselves; it’s building a system that survives contact with actual development teams under deadline pressure. The best tagging strategy I’ve implemented uses exactly three mandatory tags: Environment, Owner, and Project.

That’s it. Three tags that capture 80% of what you need for cost attribution without requiring a PhD in cloud economics. Environment tells you whether this is something you can safely shut down at night. Owner gives you someone to blame when costs spike. Project maps to your budget line items. Everything else is nice-to-have metadata that gets ignored when deadlines loom.

The enforcement mechanism matters more than the taxonomy. Use AWS Config rules to automatically flag untagged resources, and make tagging part of your infrastructure-as-code templates. I’ve seen teams try to retroactively tag six months of resources, and it’s like trying to organize your garage while your house is on fire. Build the discipline early, or pay the price later.

The Hidden Goldmine in Your Storage Buckets

Storage costs creep up on you like a subscription service you forgot to cancel. You throw some files in S3 Standard, promise yourself you’ll set up lifecycle policies later, and suddenly you’re paying for ten terabytes of logs from 2019 that nobody will ever read again.

The biggest win here isn’t switching to cheaper storage classes, though that helps. It’s implementing intelligent tiering with some actual intelligence behind it. S3’s automatic tiering is fine, but it’s reactive. You can be proactive by analyzing your access patterns before the month-end bill arrives.

I use a simple script that runs monthly and identifies objects that haven’t been accessed in 90 days. Anything older than that gets moved to Glacier automatically. Logs older than a year go to Deep Archive unless there’s a compliance reason to keep them warm. And here’s the kicker: I set up CloudWatch alarms that trigger when storage costs increase by more than 20% month-over-month. Because the best time to optimize storage is before it becomes a problem.

Right-Sizing: The Art of Productive Paranoia

Right-sizing sounds like consultant-speak, but it’s really just applied paranoia. Most of us provision instances like we’re planning for Black Friday traffic every day. That m5.2xlarge you launched for a proof-of-concept six months ago is probably still running at 12% CPU utilization, cheerfully burning through your budget.

AWS Compute Optimizer will tell you which instances are oversized, but it won’t tell you why they’re oversized. Maybe that server really does need those 32 cores for the end-of-month batch job that runs for four hours. Or maybe someone just clicked the biggest instance type because it felt safer. The difference matters for your optimization strategy.

My approach is to track the business justification alongside the technical metrics. Every instance above a certain size threshold gets a comment in our asset management system explaining why it needs those resources. When optimization time comes around, you’re not just looking at CloudWatch graphs; you’re looking at business context. That makes the difference between optimization and accidental downtime.

Building Cost Consciousness Into Your Development Culture

The most effective cost optimization happens before resources get provisioned. But making developers think about costs requires more finesse than sending around spreadsheets and hoping for the best. The teams that nail this treat cost visibility like any other operational metric.

What works is showing cost trends in the same dashboards where teams track their application metrics. When the deployment pipeline shows both response times and infrastructure costs for the last deployment, cost becomes part of the conversation. When your Slack bot mentions that yesterday’s experiment added $200 to the monthly bill, optimization becomes social pressure.

The goal isn’t to make developers obsess over pennies. It’s to create enough awareness that they pause before spinning up that 32-core instance for a local development environment. Sometimes the most expensive infrastructure decisions happen in the fifteen seconds between typing “terraform apply” and hitting enter. A little friction in that moment can save thousands down the road.

Cost optimization isn’t about finding the one weird trick that cuts your bill in half. It’s about building systems and habits that prevent runaway costs before they happen. Because at 3 AM when something’s broken and the CEO is asking questions, you want to be the engineer who built guardrails, not the one explaining why last month’s bill has six figures.

GitHub’s AI Code Review Assistant Is Creating a Generation of Developers Who Can’t Actually Code

The Numbers Don’t Lie: We’re Building a House of Cards

GitHub Copilot Workspace hit 2.3 million active users last quarter, and here’s the kicker: two-thirds of them are developers with less than three years under their belts. At first glance, this looks like a democratization success story. Dig deeper, and you’ll find something that should make every senior engineer’s eye twitch. The Stack Overflow 2025 Developer Survey revealed that 43% of junior developers using AI coding assistants couldn’t explain the core algorithms they’d implemented in their own codebases.

Let me paint you a picture from my own team. Last month, I watched a bright junior developer submit a beautifully optimized binary search implementation for a critical performance bottleneck. The code was syntactically perfect, properly commented, and followed our style guide to the letter. When I asked them to walk me through the time complexity during code review, they stared at me like I’d asked them to explain quantum mechanics in interpretive dance.

This isn’t an isolated incident. Microsoft’s own data shows that teams using GitHub’s AI review tools are catching 34% fewer critical bugs during human code review sessions. The AI is so good at generating plausible-looking code that it’s fooling both the junior developers writing it and the reviewers who should be catching the gaps in understanding. We’re training a generation of developers to be really good at prompting AI and really bad at debugging when that AI produces something subtly wrong.

The Core Problem: Competence Without Understanding

The Carnegie Mellon study that dropped in December should be required reading for every engineering manager. When junior developers who’d been using AI tools extensively were given independent coding assessments, they scored 28% lower than their peers who’d learned through traditional methods. This isn’t about memorizing syntax or APIs. It’s about developing the mental models that let you reason about code behavior, debug edge cases, and make architectural decisions that don’t come back to haunt you at 2 AM six months later.

I’ve been debugging production systems for fifteen years, and I can tell you that the difference between a developer who understands their tools and one who just uses them becomes crystal clear when things break. AI-generated code tends to be optimistic. It assumes happy paths, normal inputs, and well-behaved dependencies. Real-world code needs to handle the chaos of production: malformed data, network timeouts, race conditions, and all the other delightful surprises that make our jobs interesting.

The GitHub Copilot Workspace documentation even acknowledges this challenge, recommending that teams implement “AI governance practices” and maintain “human oversight protocols.” But here’s the thing about best practices: they only work if people actually follow them. Junior developers under deadline pressure aren’t exactly known for their restraint when a magic code-generation button promises to solve their problems.

Technical Debt: The Gift That Keeps on Giving

Atlassian’s engineering team documented something that should terrify every CTO: a 45% increase in technical debt when junior developers relied heavily on AI code generation without proper senior oversight. This isn’t just about messy code or inconsistent patterns. We’re talking about architectural decisions made by AI models that optimize for immediate functionality rather than long-term maintainability.

I’ve seen AI-generated code that reimplements existing utility functions, introduces subtle memory leaks, and creates dependency chains that would make Rube Goldberg proud. The code works, it passes tests, and it ships on schedule. Six months later, when you need to extend that functionality or debug a performance issue, you discover that the AI wrote a beautiful trap that’s now load-bearing infrastructure.

The insidious part is how these decisions compound. Junior developers using AI tools often don’t understand the broader system well enough to recognize when generated code conflicts with existing patterns or violates established architectural principles. They’re solving immediate problems without building the intuition that would help them avoid creating bigger problems down the line.

What Senior Engineers Can Actually Do About This

Before you start drafting that company-wide memo banning AI tools, take a breath. The technology isn’t going away, and trying to fight it is like trying to stop the tide with a strongly-worded Slack message. Instead, we need to evolve our mentorship and code review practices to work with this new reality.

First, change your code review process. Don’t just look at what the code does, make sure the author can explain why it does it that way. I’ve started asking junior developers to walk me through their AI-generated code during reviews, treating it like they’d inherited legacy code from a previous team member. Can they identify potential failure modes? Do they understand the performance implications? Have they considered how this will interact with the rest of the system?

Second, implement what I call “AI-free zones” in your codebase. Pick critical components like authentication, data validation, performance-sensitive algorithms and require that junior developers implement these sections without AI assistance. Think of it like learning to do arithmetic by hand before you get a calculator. The goal isn’t to punish them; it’s to build the understanding that will make them better at using AI tools effectively.

Finally, invest in pair programming sessions where senior engineers work directly with junior developers on AI-generated code. Don’t just review the output; participate in the process. Show them how to craft better prompts, how to evaluate AI suggestions critically, and most importantly, how to recognize when the AI is leading them down a problematic path.

Building Better Developers in an AI-First World

The future isn’t about choosing between human expertise and AI assistance. It’s about creating developers who can use both effectively. The best junior developers I work with treat AI like a very knowledgeable but occasionally overconfident senior colleague. They take suggestions, but they verify, test, and understand before they commit. They use AI to explore solutions they might not have considered, but they don’t let it replace their own critical thinking.

This requires a shift in how we think about developer education and mentorship. We need to move from “here’s how to write code” to “here’s how to reason about code, regardless of who or what wrote it.” We need junior developers who can debug AI-generated functions as confidently as they debug their own work, because in the end, once that code is in production, the distinction becomes academic.

The engineers who thrive in the next decade won’t be the ones who can generate the most code the fastest. They’ll be the ones who can understand complex systems, make sound architectural decisions, and debug problems that nobody’s AI model has encountered before. Our job as senior engineers is to make sure we’re building that kind of developer, even in a world where the AI is perfectly happy to write their code for them.

What patterns are you seeing with AI-assisted development on your team? I’d love to hear how other senior engineers are adapting their mentorship approaches to this new reality.

Why Your Distributed System Debugs Like a Crime Scene Investigation

The 3 AM Phone Call That Changes Everything

Your monitoring dashboard lights up like a Christmas tree at 2:47 AM. Users can’t log in, payments are failing, and somehow the recommendation engine is suggesting cat food to people browsing enterprise software. The oncall engineer stares at a cascade of red alerts, each one pointing to a different service, and asks the eternal question: where the hell do you even start?

This scenario repeats itself across every organization running distributed systems. The complexity isn’t just in the architecture anymore, it’s in the debugging. When your application spans fifteen microservices, three data stores, two message queues, and a CDN, traditional debugging approaches collapse under their own weight. You need forensic techniques, not just logs and stack traces.

Correlation IDs: Your Digital Breadcrumbs

The first lesson of distributed debugging is simple: every request needs a passport. A correlation ID should travel with every operation from the initial API call through every service hop, database query, and background job. Without this, you’re debugging blind. I’ve seen teams spend hours chasing phantom bugs only to realize they were looking at logs from completely different user sessions.

But here’s where most implementations fail. They treat correlation IDs as an afterthought. Your tracing needs to survive service restarts, queue delays, and even partial failures. At Spotify, they embed correlation IDs in their Kafka message headers, ensuring that even asynchronous processing chains maintain their lineage. This isn’t just good practice, it’s survival in production systems that process millions of events per day.

The tools matter too. OpenTelemetry has finally matured enough to be your default choice, but watch out for the performance overhead. Sampling strategies become critical when you’re generating millions of spans per minute. A poorly configured tracer can turn your debugging solution into the next performance bottleneck you’ll be debugging at 3 AM.

When Logs Lie and Metrics Mislead

Every senior engineer has war stories about misleading metrics. That 99th percentile latency spike that made everyone panic, only to discover it was caused by a health check timeout from a misconfigured load balancer. Or the database connection pool exhaustion that showed up as random 500 errors in your application logs, nowhere near the actual database service.

The uncomfortable truth is that individual service metrics often obscure the real problem. A service might report healthy response times while upstream timeouts cause cascading failures. This is why distributed tracing matters more than traditional monitoring. Netflix’s approach of trace-driven debugging has prevented countless outages by identifying bottlenecks that individual service dashboards would never reveal.

Context switching between different monitoring tools destroys your debugging flow. The most effective teams I’ve worked with have invested heavily in unified observability platforms. Whether it’s Datadog, New Relic, or a Prometheus-based stack, the key is having your logs, metrics, and traces in one place where you can pivot between them without losing your train of thought. The cognitive overhead of remembering which tool shows what data will kill your debugging velocity when you’re under pressure.

The Chaos of Asynchronous Failures

Synchronous failures are easy. Something breaks, you get an immediate error response, and you can trace the problem backward. Asynchronous failures are where distributed systems debugging becomes an art form. Message queues introduce delays, retry logic masks intermittent failures, and eventual consistency means your data might be telling three different stories depending on when you look.

I once debugged a payment processing issue where transactions appeared to succeed in the API logs, failed in the payment service logs, but somehow completed successfully according to the accounting service. The root cause? A combination of message queue reprocessing and database replication lag that created a perfect storm of timing-dependent behavior. Traditional debugging approaches would have missed this entirely.

Dead letter queues become your archaeological record for async failures. Don’t just route failed messages there. Enrich them with context about why they failed, how many times they were retried, and what the system state was when they first entered the queue. This metadata often contains the key to understanding why certain failure patterns emerge during specific load conditions or time windows.

Building Debugging into Your Architecture

The best distributed systems are designed for debuggability from day one. This means more than just adding logging statements. It’s about building introspection into every component. Circuit breakers should expose not just their state, but their recent history. Rate limiters should show you what they’re protecting against. Database connection pools should tell you not just how many connections are in use, but which services are holding them and for how long.

Feature flags become debugging tools when used correctly. Being able to route specific user sessions or correlation IDs to different code paths lets you perform surgical debugging in production. Canary deployments aren’t just about safety, they’re about creating controlled environments where you can observe system behavior with minimal blast radius.

The economics of debugging matter too. Every minute of downtime costs money, but so does over-engineering your observability. The trick is finding the right balance between debuggability and system overhead. Google’s SRE practices suggest spending your error budget on both reliability and observability improvements. If you’re not occasionally debugging in production, you’re probably not pushing your system hard enough to matter.

The Human Element in Distributed Debugging

Technology alone won’t save you when your distributed system fails. The most effective debugging happens when your team has shared mental models of how the system works. This means investing in documentation that doesn’t just describe what each service does, but how they interact under load, what their failure modes look like, and where the hidden dependencies lurk.

Runbooks become critical when you’re debugging across multiple service boundaries. But skip the step-by-step troubleshooting guides. They become outdated the moment you write them. Instead, focus on decision trees that help engineers understand which service to investigate first based on the symptoms they’re observing. The goal is to reduce the time from “something’s broken” to “I know where to look.”

Have you ever considered how much of your architecture’s complexity exists purely to work around the limitations of your debugging tools? What would you build differently if you knew you could observe every interaction between your services with zero overhead? The answer might reshape how you think about distributed systems entirely.

Why GitHub Copilot Workspace’s 2026 Agent Evolution Actually Changes Everything (And Why The Skeptics Are Missing The Point)

The Skeptics Have a Point, Until They Don’t

Look, I get it. Another AI coding tool promising to change everything. Another announcement that this time it’s different. We’ve been through this dance before with code completion tools, automated testing frameworks, and low-code platforms that were supposed to make us all obsolete. The skepticism is earned, especially from those of us who remember debugging generated code at 3 AM while muttering creative profanities.

Why GitHub Copilot Workspace's 2026 Agent Evolution Actually Changes Everything (And Why The Skeptics Are Missing The Point)
Why GitHub Copilot Workspace’s 2026 Agent Evolution Actually Changes Everything (And Why The Skeptics Are Missing The Point)

But here’s where the skeptics are missing something important about GitHub Copilot Workspace’s January 2026 evolution into a full agentic development environment. This isn’t about better autocomplete or smarter code suggestions. It’s about crossing the line from reactive assistance to proactive problem solving. When Microsoft reports a 73% reduction in time-to-first-commit for new features using Workspace’s full agent mode, we’re not talking about typing faster. We’re talking about thinking faster.

The distinction matters more than you might think. Previous iterations of AI coding tools lived in the tactical space, helping you complete the thought you were already having. Workspace operates in the strategic space, helping you think through problems you haven’t fully formed yet. That shift represents a real change in how we approach software development, not just an improvement in how quickly we write code.

Illustration for Why GitHub Copilot Workspace's 2026 Agent Evolution Actually Changes Everything (And Why The Skeptics Are Missing The Point)
Illustration for Why GitHub Copilot Workspace’s 2026 Agent Evolution Actually Changes Everything (And Why The Skeptics Are Missing The Point)

What Autonomous Issue Resolution Actually Means

When we say “autonomous issue resolution,” we’re not talking about magical problem-solving fairy dust. We’re talking about a system that can read a GitHub issue, understand the context of your codebase, propose an implementation strategy, scaffold the necessary files, and present you with a working solution that integrates with your existing architecture. It’s the difference between a very smart autocomplete and a very competent junior developer who never sleeps and doesn’t need coffee.

The GitHub Copilot Workspace official documentation shows the technical sophistication behind this capability. The system maintains context across your entire repository, understands your coding patterns, respects your architectural decisions, and can reason about dependencies both explicit and implicit. When you file an issue requesting a new API endpoint, Workspace doesn’t just generate the handler function. It updates your OpenAPI specs, adds corresponding tests, updates documentation, and makes sure the new endpoint follows your established authentication patterns.

This level of contextual awareness changes the economics of software development in ways that pure productivity metrics barely capture. The mental overhead of context switching between files, remembering naming conventions, and ensuring consistency across a large codebase takes up a huge portion of developer brain power. When an agent handles that cognitive burden, you’re free to focus on the interesting problems: the business logic, the user experience, the architectural decisions that actually matter.

The Cross-Repository Reasoning Revolution

February’s announcement of Anthropic’s Claude 3.5 Sonnet integration with GitHub introduces another dimension that completely changes how we think about code organization and reuse. Cross-repository reasoning means the agent can understand patterns and solutions across your entire organizational codebase, not just the current project. It can spot when you’re solving a problem that’s already been solved elsewhere, suggest appropriate abstractions, and help maintain consistency across team boundaries.

This addresses one of the most persistent challenges in scaling engineering organizations: knowledge silos. Every experienced developer has spent days implementing something that already existed in another team’s repository, just with slightly different naming conventions or wrapped in a different abstraction. Cross-repository reasoning makes that institutional knowledge accessible and actionable, turning your organization’s collective codebase into a searchable, understandable knowledge graph.

The architectural planning features deserve special attention here. When Workspace can reason across repositories and understand your organization’s patterns, it can suggest architectural decisions that align with existing systems rather than creating new inconsistencies. It’s like having a tech lead who has read and understood every line of code your organization has ever written, and can recall that knowledge instantly when making design decisions.

The Numbers Tell a Story About Developer Intent

Stack Overflow’s 2026 Developer Survey showing 67% of senior developers using AI agents for initial code scaffolding isn’t just adoption statistics. It shows how experienced developers choose to spend their time. Senior developers aren’t early adopters of productivity tools because they want to type less code. They adopt tools that let them focus on the parts of software development that require human judgment, creativity, and deep domain expertise.

The jump from 23% to 67% in a single year suggests we’ve crossed the productivity threshold where the tool becomes genuinely useful rather than merely interesting. Microsoft’s AI development productivity research explains why this threshold matters. When AI assistance reaches the point where it reduces cognitive load rather than increasing it, adoption accelerates rapidly among developers who value their cognitive resources.

Shopify’s reported 45% improvement in sprint completion rates when combining Copilot Workspace with existing CI/CD pipelines shows how agentic development integrates with modern software development practices rather than replacing them. The agent isn’t circumventing your deployment pipeline or bypassing your code review process. It’s accelerating the feedback loops that make those processes effective, getting you to deployable code faster so you can iterate on the things that matter: user feedback, performance characteristics, and business outcomes.

Why This Time Really Is Different

The difference between Copilot Workspace’s 2026 evolution and previous AI coding tools lies in the scope of automation. Previous tools automated syntax and common patterns. Workspace automates entire development workflows while preserving the decision points that require human judgment. It’s the difference between a better hammer and a construction crew that knows when to use different tools.

This becomes clearer when you consider what the agent doesn’t try to automate: product decisions, user experience choices, business logic trade-offs, and architectural philosophy. What it does automate is the mechanical work of translating those decisions into working code that integrates properly with your existing systems. The result is that developers spend more time on the creative and strategic aspects of software development and less time on the mechanical aspects.

The skeptics who dismiss this as “just another coding tool” are missing the bigger picture. This isn’t about replacing developers or making coding easier for non-programmers. It’s about raising the bar of what individual developers can accomplish, allowing small teams to build and maintain systems that previously required much larger teams. That’s not incremental improvement. That’s a real shift in the economics of software development.

What’s your experience been with agentic development tools? Are you seeing similar productivity gains in your workflows, or are there specific pain points where current AI assistance still falls short? I’m particularly curious about how teams are handling code review processes when a significant portion of the initial implementation comes from an agent.

Why I Spent Three Months Reading Every Line of SQLite’s Source Code

The 2 AM Revelation That Started Everything

Picture this: production is down, users are screaming, and your database is doing something that makes absolutely no sense according to the documentation. You’re three energy drinks deep, staring at query execution plans that look like abstract art, when you realize the only way forward is to crack open the source code of SQLite itself. That was my Tuesday night last spring, and it changed how I think about database internals forever.

What started as desperate debugging turned into a three-month deep dive through 150,000 lines of some of the most carefully crafted C code I’ve ever encountered. SQLite isn’t just a database engine. It’s a masterclass in software engineering disguised as a library that fits in 700KB. The more I read, the more I understood why it powers everything from your iPhone’s contact list to the International Space Station’s flight software.

The Architecture That Makes Other Databases Jealous

Most databases are sprawling beasts with separate processes for storage, query planning, and transaction management. SQLite laughs at this complexity. The entire engine is a single C library with zero external dependencies. No network protocols, no configuration files, no daemon processes. Just you, your application, and a file on disk that happens to be one of the most sophisticated data structures ever created.

The secret sauce lives in the virtual machine architecture. Every SQL query gets compiled into bytecode that runs on SQLite’s internal VM. When you write SELECT * FROM users WHERE age > 25, the query planner generates a sequence of opcodes like OpenRead, Column, and ResultRow. It’s like having a tiny computer inside your computer, optimized for one thing: moving data around with surgical precision.

The btree implementation alone is worth the price of admission. Richard Hipp and team didn’t just copy the textbook algorithm. They optimized for real-world access patterns, added clever tricks like prefix compression for keys, and wrapped the whole thing in a transaction system that guarantees ACID compliance even if someone yanks the power cord mid-write. Try explaining that to your PostgreSQL cluster.

Testing Like Your Reputation Depends On It

Here’s where things get serious. SQLite has 711 times more test code than implementation code. Read that again. For every line of C that ships with SQLite, there are 711 lines dedicated to making sure it works correctly. The test suite includes boundary condition checks, fault injection scenarios, and stress tests that would make a Toyota reliability engineer weep with joy.

They test what happens when malloc() fails at precisely the wrong moment. They simulate disk corruption, power failures, and operating system bugs. There’s even a test that runs the database engine in a mode where every single memory allocation is tracked and tested for leaks. When they say SQLite is the most tested software component in the world, they’re not marketing. They’re stating a verifiable fact.

The documentation includes actual test results showing 100% branch coverage and 100% MC/DC coverage. In aerospace terms, that’s the kind of testing you demand when human lives are on the line. For a database library, it means you can deploy SQLite knowing it won’t mysteriously corrupt your data because someone forgot to handle an edge case in the page splitting algorithm.

Performance Lessons From The Trenches

Reading SQLite’s source teaches you things about performance that no computer science textbook covers. Take the page cache implementation. Instead of using a generic LRU algorithm, they built a custom cache replacement strategy that understands database access patterns. Hot pages stay in memory longer, sequential scans don’t thrash the cache, and the whole system adapts to your application’s behavior without you writing a single line of configuration.

The query optimizer is another revelation. It doesn’t try to solve the traveling salesman problem for every JOIN. Instead, it uses heuristics and cost estimates that work well for the queries people actually write. Want to join five tables? SQLite will find a good execution plan in microseconds, not the minutes some enterprise databases take to overthink the same problem.

Memory allocation deserves special mention. SQLite includes its own memory allocator that’s tuned for database workloads. It minimizes fragmentation, tracks usage patterns, and can even operate in environments where malloc() isn’t available. When you’re running on embedded hardware or in constrained environments, these details matter more than any fancy SQL feature.

Why This Matters Beyond Curiosity

Three months of reading SQLite source code taught me more about systems programming than a decade of working with black-box databases. You start to understand the trade-offs behind every API decision, the reasoning behind seemingly arbitrary limitations, and the incredible engineering effort required to make something appear simple.

But here’s the practical payoff: when you understand how SQLite actually works, you write better SQL. You know why certain query patterns are faster, which indexes actually help performance, and how to structure your schema for optimal storage efficiency. You stop fighting the database and start working with it. That production incident that started this whole journey? It was a query plan issue that became obvious once I understood how the optimizer makes decisions.

The next time you’re debugging a gnarly database problem, consider reading the source. Not just SQLite, but whatever open source project is giving you trouble. The answers are sitting right there in the code, written by engineers who’ve already solved the problems you’re wrestling with. Sometimes the best documentation is 150,000 lines of carefully crafted C that just happens to power half the software in existence.

Why Solid.js Is Eating React’s Lunch (And Why You Haven’t Heard About It)

Last Tuesday at 2:47 AM, I watched our dashboard rebuild 847 components because someone updated a user’s preference setting. React’s reconciliation engine was doing exactly what it was designed to do, but watching those orange flame bars in the profiler felt like watching money burn. The next morning, I started porting a critical component to Solid.js. Three weeks later, our largest interactive widget renders 340% faster.

Framework wars are exhausting, but every few years something genuinely different emerges from the noise. Solid.js isn’t another React clone with marginally better DX. It’s a fundamental rethink of how reactive systems should work, and it’s starting to show up in places that matter.

The Reconciliation Tax Nobody Talks About

React’s virtual DOM was revolutionary in 2013. Compared to jQuery soup and manual DOM manipulation, the declarative component model felt like magic. But ten years later, we’re paying a hidden tax that most developers never see in their TodoMVC tutorials. Every state update triggers a reconciliation cycle that walks the component tree, even when 99% of that tree hasn’t changed.

Solid.js sidesteps this entirely with fine-grained reactivity. When you update a signal, only the specific DOM nodes that depend on that signal get updated. No virtual DOM, no reconciliation, no diffing algorithm. It sounds too simple to work, but the performance characteristics speak for themselves. In our production app, we went from 16ms frame drops during heavy interactions to consistent 2-3ms updates.

The learning curve is gentler than you’d expect if you’re coming from React. JSX looks identical, components are just functions, and the mental model maps cleanly. The main difference is trading React’s useState for Solid’s createSignal, which returns a getter/setter tuple instead of a value/setter array. It’s different enough to feel intentional, similar enough to feel familiar.

Framework Weight Classes and Performance Reality

Bundle size discussions usually turn into framework Olympics, but the numbers tell a story worth hearing. React + ReactDOM clocks in around 45KB gzipped. Solid’s runtime is 8KB. That’s not a rounding error, it’s a different design philosophy. Solid compiles away most of its abstractions at build time, leaving behind tight, optimized JavaScript that directly manipulates the DOM.

More interesting than bundle size is runtime performance. In the JS Framework Benchmark, Solid consistently outperforms React, Vue, and Angular across memory usage and update operations. These aren’t synthetic victories either. We’ve seen similar improvements in real applications with complex state management and frequent updates. The fine-grained reactivity system eliminates the overhead that other frameworks accept as the cost of doing business.

The architecture also means Solid applications start fast and stay fast as they scale. React applications often hit performance walls when component trees get deep or when state updates become frequent. Solid’s approach scales linearly because it’s not doing extra work to figure out what changed. It already knows.

State Management That Doesn’t Fight You

Redux felt necessary because React’s built-in state management wasn’t designed for complex applications. Context helped, but came with performance gotchas that required careful memoization and component splitting. With Solid, stores are just objects with signals as properties, and the reactivity system handles subscriptions automatically.

Here’s what surprised me most: we eliminated three third-party state management libraries when porting components to Solid. Not because Solid is more feature-rich, but because the built-in primitives are powerful enough that additional abstraction layers become unnecessary. createStore handles nested updates elegantly, and signals compose naturally without the boilerplate that Redux or Zustand typically require.

The debugging story is also cleaner. When state updates don’t behave as expected in React, you’re often debugging the reconciliation algorithm, timing issues, or closure problems. In Solid, data flows directly from signals to DOM nodes, making it easier to trace problems to their source. DevTools support is getting better, though it’s not quite at React’s level yet.

Ecosystem Realities and Migration Paths

Solid’s ecosystem isn’t React’s ecosystem, and that matters for anything beyond greenfield projects. You can’t drop in React components or use most of the npm packages that assume React’s component model. Solid Start provides a Next.js-like development experience, and the core primitives are stable, but you’ll be reaching for community libraries that are still maturing.

That said, incremental adoption is possible and practical. We started by porting isolated components that had performance problems. Solid components can render into existing DOM containers, so you can gradually replace React components without rewriting entire applications. The mental model is close enough that experienced React developers can be productive within a few days.

The TypeScript support is excellent, which shouldn’t surprise anyone given that Solid’s creator, Ryan Carniato, has been thinking about reactive systems for years. Type inference works as expected, and the JSX transform plays nicely with modern build tools. We’re using Vite for development builds and haven’t run into any tooling friction.

Production Readiness and What’s Next

Solid 1.0 shipped in 2021, and the API has been stable since then. Several companies are running Solid in production, though you won’t hear about it at conferences because it’s not fashionable yet. The framework is mature enough for serious applications, but still small enough that you might find yourself contributing to libraries instead of just consuming them.

The roadmap focuses on developer experience improvements and ecosystem growth rather than fundamental architecture changes. Solid Start is getting server components, which could be interesting given Solid’s compile-time optimizations. The community is small but engaged, with active Discord discussions that actually solve real problems.

What gets me excited about Solid isn’t just the performance improvements. It’s the reminder that we don’t have to accept the complexity tax that comes with popular frameworks. Sometimes the best solution isn’t the one everyone’s talking about, but the one that solves real problems with elegant engineering. Next time you’re profiling a slow interaction or debugging a mysterious re-render, consider whether you’re solving the right problem or just working around architectural limitations.